
Each spring, before peak summer hits full stride, Zebulon invites outfit owners and leaders to pause to look at the data. ‘Tis the season – again!
On April 21st, 2026, we hosted a live data share during our monthly Groover Gab meetup. We pulled back the curtain on what Zebulon’s Central Data Hub shows through the first 16 weeks of 2026, from January 1 to April 20.
In this 2026 Summer Scout Report we’ll show data snapshots accompanied with insights gleaned from our experts and fellow outfitters during the live session.
So, buckle up for our data-driven report as we attempt to answer the question on everyone’s mind:
How’s the 2026 summer season shaping up?
The Devil Is In The (Data) Details
The shining star of this year’s Scout Report is, once again, our Central Data Hub. Kayla, our in-house data whiz, diligently manages all our data sources and, without her, we’d be up a major (data) creek without a paddle.

In addition to Zebulon’s proprietary industry data we’ll look at some public, big-picture stuff, too: one major index and reliable fuel predictions. This provides a broader context for the realities we’re living in our “small- to mid-sized outdoor adventure industry” world.
Who’s Represented In This Scout Report? 10 Outfits Nationwide
The screenshots below contain a stable population of 10 outfits, representing four distinct time zones: Pacific, Mountain, Central, and Eastern.
While our Central Data Hub contains data for many more than just ten outfits, we narrowed our Scout Report parameters to include only outfits that have:
- Complete data sets going all the way back to pre-pandemic (2019 through 2026).
- No large anomalies to throw off our charts, like business units sold or purchased.
The Big Picture: Don’t Let the Headlines Fool Ya’
Take a look at this IDEA chart, the Index of Economic Activity from the US Census Bureau. The IDEA is a weighted combo of 15 of the Census Bureau’s fave economic indicators, and the “0” line in the middle is considered the “as expected” baseline. Note the dip in April 2025 that reflects the tariff frenzy, and the generally strengthening average since then, shown by the doted support trend line – plus, we’re on a three-month above-zero trend!

Who’s Afraid of the Big Bad Gas Pump?
We get it: headlines are flashy. And, particularly, headlines from spring 2026 might make you think oil prices are out of this world!
The truth is, 2026’s projected peak of $4.30/gallon still hits below recent historical highs of $5.03/gallon from June 2022. See the charts for yourself over at the U.S. Energy Information Administration – but just remember that we’ve survived worse, and in recent memory.
Here’s what Robert, Zebulon’s financial manager, has to say about gas prices: “Consumer purchase behavior has changed this year as a result. People aren’t buying (activities) early, and expectations around cash flow shouldn’t be compared to prior year, but viewed in a silo with more scrutiny, because folks are simply waiting longer to buy their trips.” Well said, Robert.

Real-Time Pulse Check
To get a feel for the room, we posed a series of survey questions to all attendees of our live Groover Gab session. Basically, we conducted a vibe check, and our 30+ attendees gave us their honest feedback.
Here’s what they had to say:

As seen by the survey results, audience sentiment was pretty evenly spread across the board – with most people saying both the broader economy and their 2026 business sales felt about the same as 2025. Generally, attendees are feeling optimistic about 2026 revenue and activities, which is also reflected in our data below!
What Zebulon’s 2026 Data Shows (Weeks 1-16; Jan 01-Apr 20)
It’s time to let the data do the talkin’.
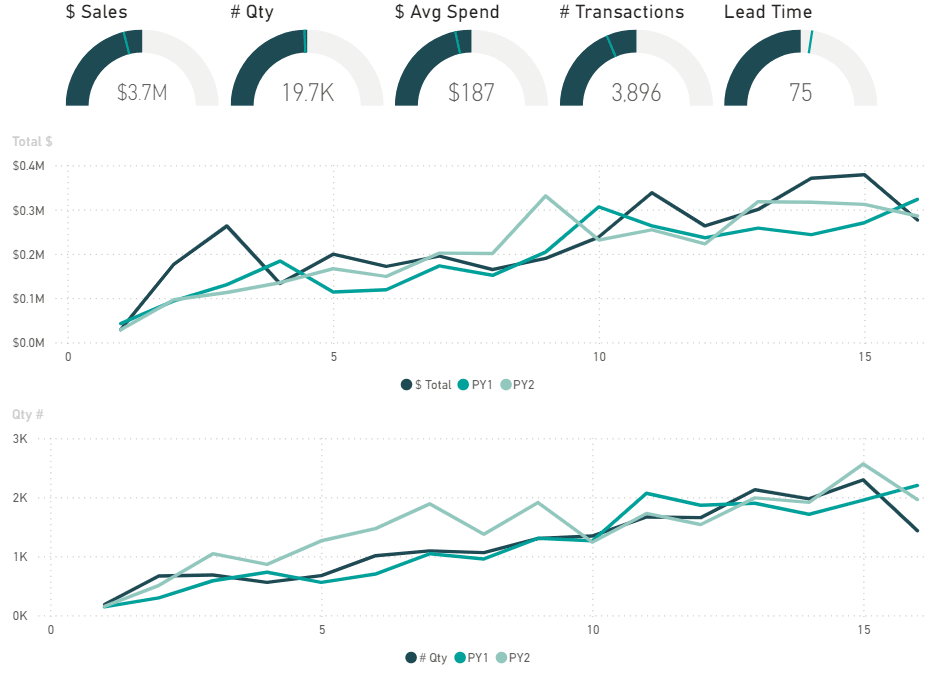
Volume is Stable; Spend is Strong
Zebulon’s booking data for Weeks 1-16, 2026 shows passenger volume is stable. In fact, volume is essentially flat, with our Central Data Hub tracking just a 2% drop.
However, despite this 2% drop in volume, the average price is up 24%. That’s almost $35 more per passenger purchased, across the board. Know what that means? When average unit price goes up, so does revenue – so in 2026, we’re clocking 21% more year-to-date sales over 2025. Not bad!
Even where volume is merely flat, stronger spend per booking is pushing topline performance higher. That flat volume/stronger spend combo is much healthier business-wise than volume growth from practices we don’t recommend, like heavy discounting.
Click on the image above to enlarge.
Lead Times Feel Short – But Context Matters
Anecdotally, outfitters feel like customers are making bookings much closer to their activity date than they used to. Our data shows this to be partially true, but context is king.
Think back to the pandemic years: Consumers were obsessed with getting outside, people spent months at a time isolated and daydreaming about future adventures, and many passengers had the wherewithal to secure their spots way, way in advance.
 Outfitters saw unusually extended lead times in the FOMO-fueled post-pandemic summers of 2021-2024.
If we zoom out to the “before times,” lead time averaged under 60 days in 2019. Well, guess what? Lead time in 2026 is returning to that pre-pandemic level, with the average activity getting booked 68 days in advance.
Unexpected Takeaway: Cancellation Income Drops
When we drilled down into this year’s revenue sources, we noticed a new-to-us trend: Cancellation income has reduced to practically nothing compared to 2023’s high.
Now, we’re not talking “money out” here (i.e. funds returned to consumers when they cancelled), we’re talking about money retained (i.e. the “non-refundable” stuff outfitters keep in their pockets after a cancellation is processed).
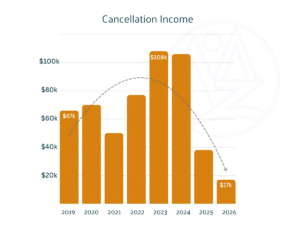 Why is this? Here’s how we see it: During the pandemic-fueled outdoor activity surges in 2020-2021, many people wanted to do activities but found their preferred outfitters had reached capacity. So, we figure people developed FOMO (“Fear Of Missing Out”) and started booking trips willy-nilly in 2022-2024 to capture sought-after space, regardless of if they wholeheartedly planned to attend.
Now in 2025-2026, the FOMO-factor has cooled (and Covid-era stimulus checks are long gone). To us, this shows that consumers are being much more deliberate with their purchasing – which translates into a significant reduction in those non-refundable cancellations.
Water-Based vs. Land-Based: Activities are Looking Strong
During our live session, we used the Central Data Hub to drill down from broad data into smaller subsets. We looked at water-based operating trends, land-based operating trends, and then we drilled even further into guided and non-guided activities, specific activity types (like rafting, pontoons, and jet-ski), skill-level, and more.
Water Activities: Demand is Easing
In the water world, we’re seeing another season of slight decreases in volume from the Pandemic peak.
Our national frenzy to get on the water has ebbed a little since 2021, meaning 2026 water-based activities (including rafting, kayaking, boat rentals, tubing, and more) are clocking about 4% lower than 2025. Importantly, this drop in volume is more than made up for by a 32% average increase in price.
Interestingly, water-based operators are feeling the shorter booking window pinch – lead time for water-based activities has shrunk by 11 days so far in 2026.
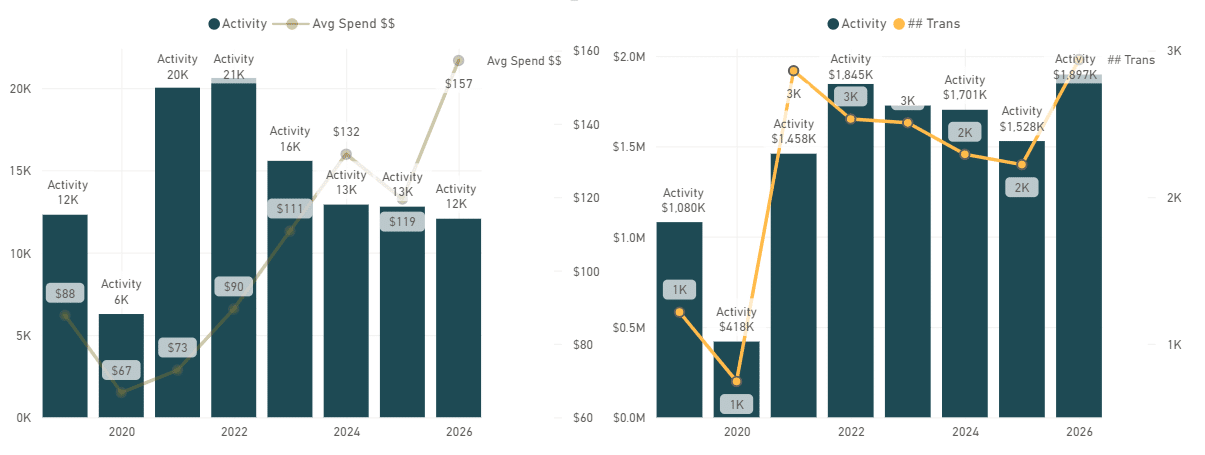
Water-based activities: Click the image above to enlarge.
Take a Hike: Land-Based Demand Keeps Growing
In contrast to water-based activities, in 2026 we’re seeing another steady climb in land-based activities (including hiking, zip lines, UTVs, etc.). Land-based activities, such as Jeep and hiking tours, have grown 4% in 2026 over 2025, and this positive trend is compounded even further considering these activities are priced on average 10% higher.
Lead time for land-based activities hasn’t changed significantly from 2025 to 2026.
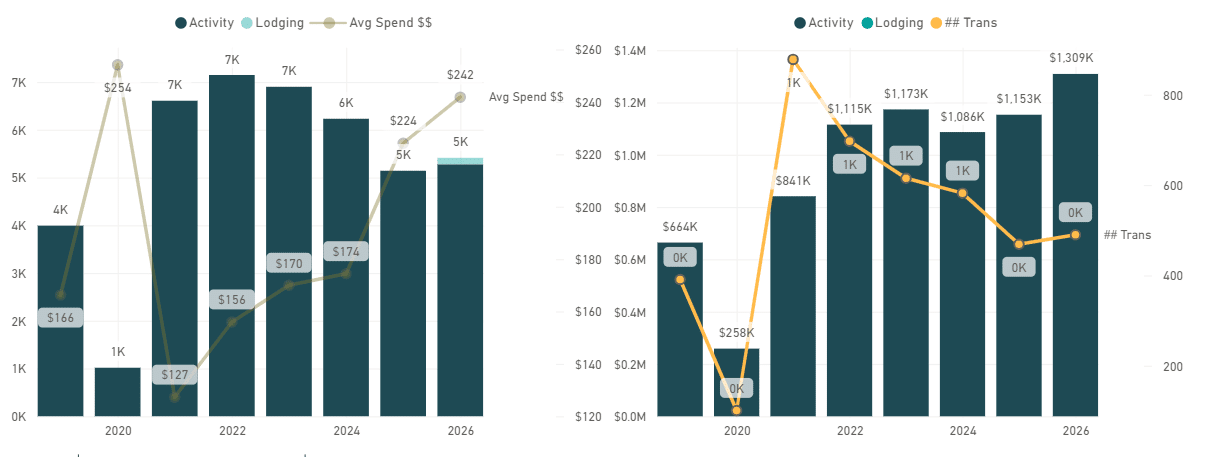
Land-based activities: Click the image above to enlarge.
What Outfitters Should Watch For in 2026
1. Average Spend Carries the Team
If you’re new around here, you may not know just how fiercely Zebulon advocates for outfitters charging what they’re worth.
Gone are the days of cost-plus and competitive pricing. By taking a value-based approach to activity pricing, the importance of average spend outweighs raw volume numbers. (Pro-tip: Value-based pricing means aligning your prices to match what customers would expect to pay for a truly exceptional experience. This results in both happier customers and happier bottom lines.)
As shown by our data above, pairing flat-to-stable volume with strategic pricing and stronger spend still produces healthy, sustainable seasons for outfitters. We love to see it!
2. ’26 Lead Times Are Shorter Than ’25 – But Small Can Be Mighty
Lead times are returning to the pre-pandemic baseline of what’s considered “normal.” Sure, having the extra time in 2021-2025 to plan for increased passenger volumes was nice; but that doesn’t mean we can’t adapt.
Operators should respond to lead time changes with demand-based pricing discipline, strong in-season marketing, upselling and cross-selling practices, and streamlined scheduling using AI-infused tools. If you’re adaptable, shorter lead times aren’t a worrisome indicator but a sign of stability and opportunity – finally.
3. Mix It Up: A Diverse Activity Portfolio is a Strong Activity Portfolio
Outfitters shared during our live session that unique experiences are standing out this year and beyond.
- Glamping? Already reaching capacity!
- School groups? Coming in hot, for the first time in recent memory!
- International travelers? Upcoming tourneys like the ’26 World Cup in 2026 and the ’28 Olympics have the potential to reverse the general international downturn. International folks are already shelling out for bucket-list athletic tickets, so what’s a little more expense to get the adrenaline pumping at your outfits?
To us, this means specialty products – and new adaptations to classic services – may be carrying more momentum than legacy activities. Being flexible, adaptable, and creative may just be your ticket to go from another grind-it-out season to a fun and profitable 2026 adventure.
Take, for example, Zebulon client Verde Adventures – when a permitting snag meant last season’s highest-selling experience was suddenly off the table, we leapt into action to help innovate a completely new service offer: the River to Rose kayaking & outdoor wine tasting experience. Guess what? This first-of-its-kind new offer is already exceeding target numbers for 2026 – and we’re only getting started.
4. Weather And Niches: The Elephants In The Room
It’s important to note that everyone’s regional-based realities are going to be different than the broader, nationwide data.
If you’ve got a hyper-niched service offer, you may be setting yourself up for an unexpectedly off-the-charts year; if you’re a water-based operator in the snow-parched West and Mountains, you may be staring down the barrel of a very, very low season.
This is where the importance of truly knowing your target audience becomes clear. By setting yourselves apart, and making clear your operation is the only logical choice for consumers, you can still harness success regardless of niche or weather.
Business Is About Looking Forward, Not Backward
Here at Zebulon, business isn’t about looking to the past, it’s about looking toward the future.
One of the biggest advantages of the Central Data Hub is our ability to help growth-oriented operators move beyond rearview-mirror management.
Yes, historical reporting can be valuable, but that’s merely chasing past performance. In our eyes, healthy business growth is driven by making forward-looking decisions around pricing, targets, and capacity, before the season even gets into full-swing.
Want An Even Fuller Picture?
This Scout Report is just scratching the surface. Our Central Data Hub allows us to drill down far beyond broad industry snapshots and show outfitters an under-the-hood look at their own booking behavior, demand trends, pricing opportunities, future-facing targets, and more.
If you’re curious how your outfit stacks up, or if you’re itching to see your own numbers in our dashboards, schedule a meeting to start exploring together. Or, if you just want to hear from a fellow outfitter how they use Zebulon to boost their business education and bottom line, check out this Fireside Chat with Dave Logan of Four Season Guides.
The Eddy: Dive Deeper, All Year Round
Our once-annual, live Groover Gab scout report session is an excellent way to get a feel for the upcoming season – but remember, it’s just one glimpse of a broad snapshot in time.
For those hungry for more specific details: the members of our leadership peer group The Eddy get under-the-hood access to our data year-round. In fact, Eddy members get monthly data shares with no holds barred in addition to our hand-crafted learning curriculum for outdoor adventure businesses.
If you’re ready to get off the island and dive deeper into the data year-round, we’d love to have you in The Eddy.
FAQ: The TL;DR of Zebulon’s 2026 Outdoor Industry Trends
How are outfitter bookings looking in 2026?
Based on Zebulon’s data for weeks 1-16 of 2026, preseason sales are encouraging. Volume is on-par with 2025, and higher 2026 average spend is pushing hard-dollar revenue amounts beyond 2025 levels.
Are lead times shrinking for activity bookings?
Many operators are seeing shorter 2026 booking windows than, say, post-pandemic peak years like 2023. However, the long-term historical picture shows lead times are returning to the pre-pandemic baseline.
What activities are trending in 2026?
In Zebulon’s 10-outfit, nationwide sample, average spend is up meaningfully in several categories in 2026, including land-based and guided activities. Water-based activities are down slightly from 2025.
Will gas prices impact demand for activities?
Gas remains a hot-button issue, but historical data shows 2026 prices are still within the range of what most outfitters have already navigated in recent years.
What’s the 2026 takeaway?
According to Zebulon’s data, purchasing volume is flat, average ticket order is up, and revenue is up, too. It’s time to work smart, have fun, and make money!