Welcome to the archives of our “Data Snacks” series.
Feeling Hungry? Grab a Data Snack!
Zebulon’s Central Data Hub is an immensely powerful tool for us and our clients. Our dashboards allow us to zoom out to see bigger-picture industry trends, while also allowing us to drill down to the tiniest, outfit-specific detail.
However, it’s no fun if we keep ALL this data to ourselves. Below you’ll find the archives of the scrumptious tidbits of data we call “Data Snacks,” fresh out of the oven that is our Central Data Hub. Newer snacks start at the top; scroll all the way to the bottom for our older, original graphics.
Data Sources In Zebulon’s Central Data Hub
Published November 2025.

Click on the image above to enlarge.
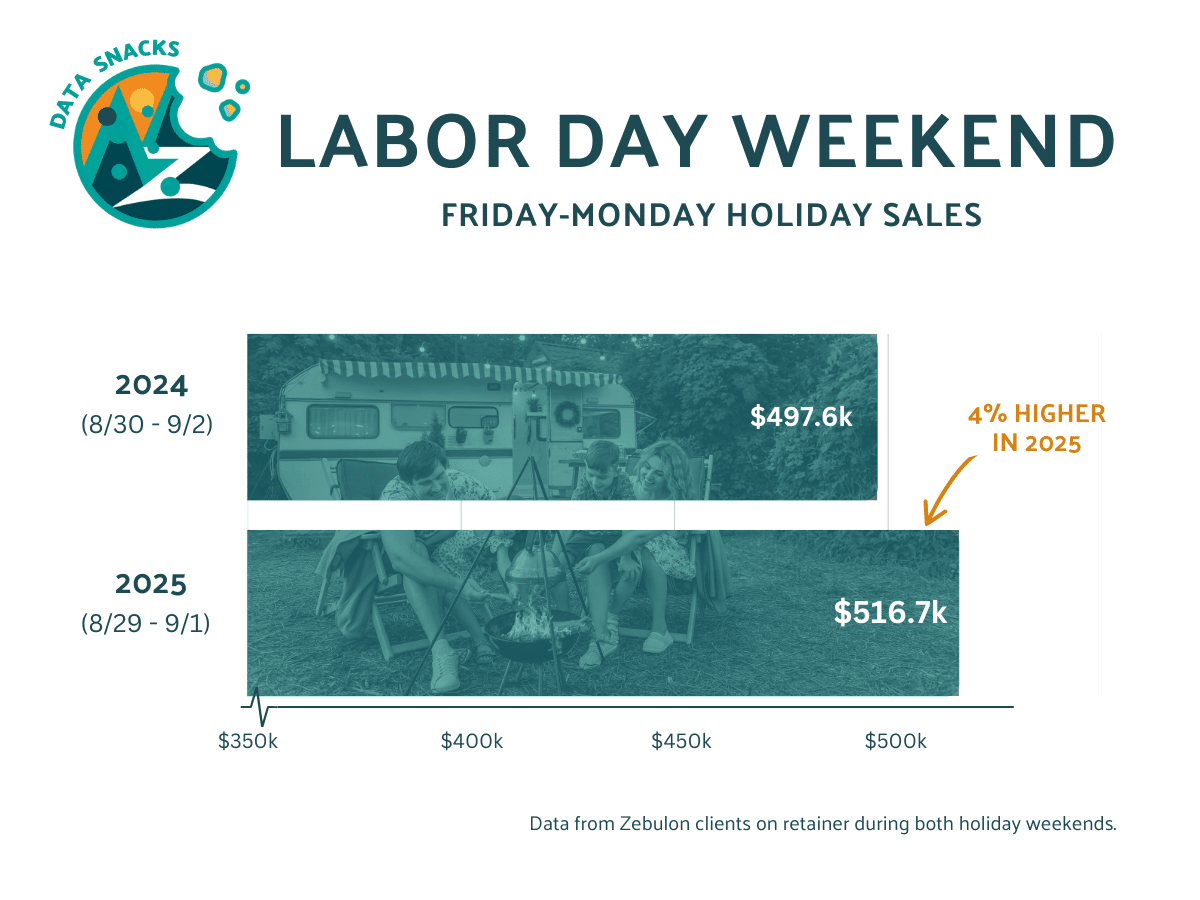
Labor Day Weekend Sales, YoY (2025 vs. 2024)
Published September 2025.
Click on the image above to enlarge.
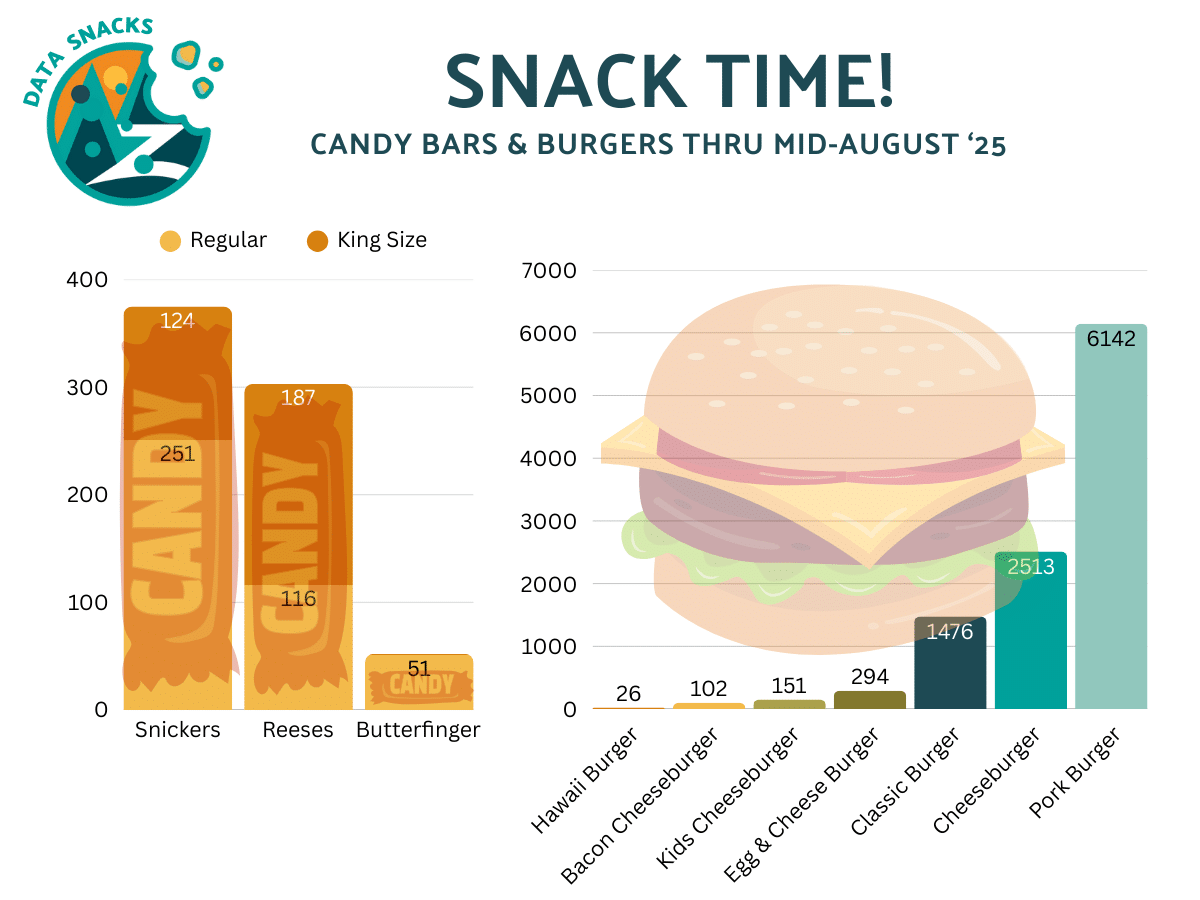
Snack Time: Candy Bars & Burgers
Published August 2025.
Click on the image above to enlarge.
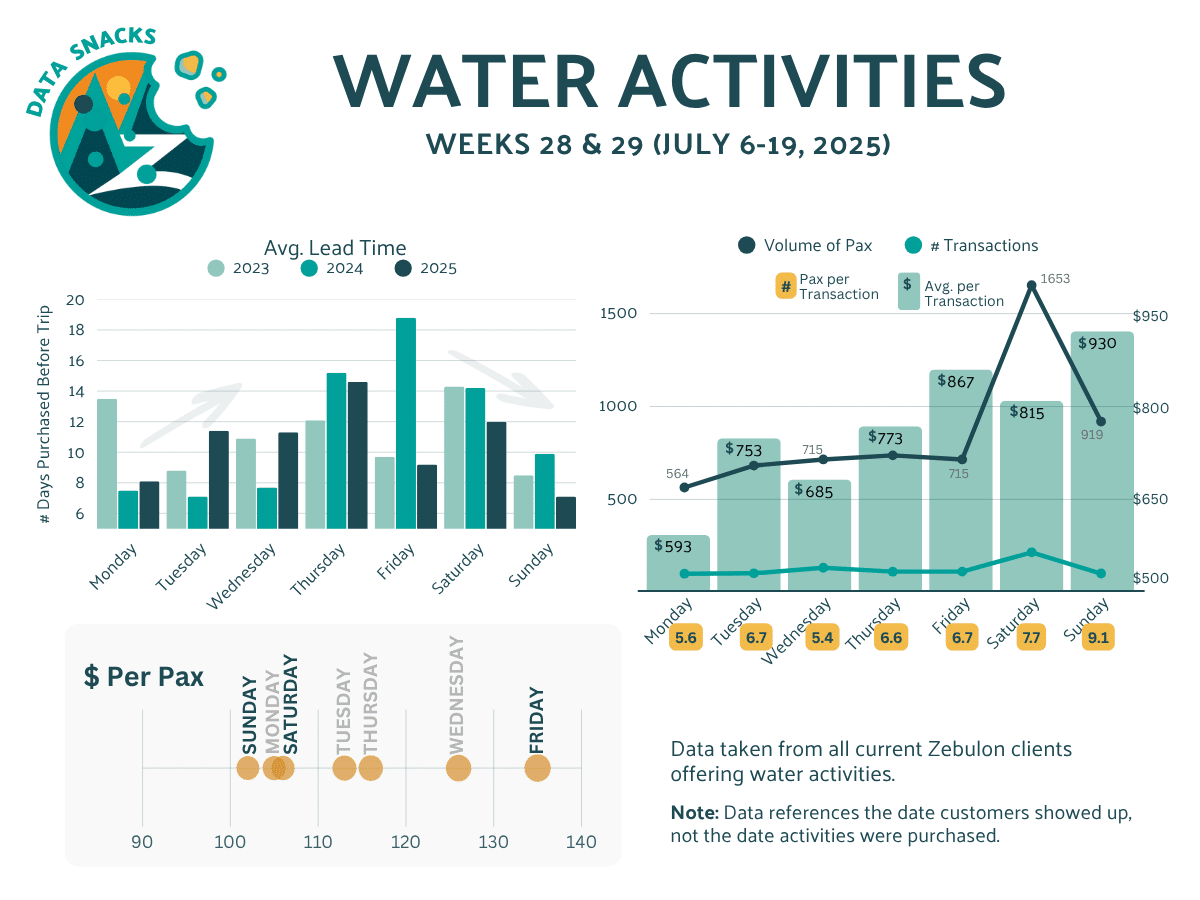
Water Activities: 2025, Weeks 28 & 29
Published July 2025.
Click on the image above to enlarge.
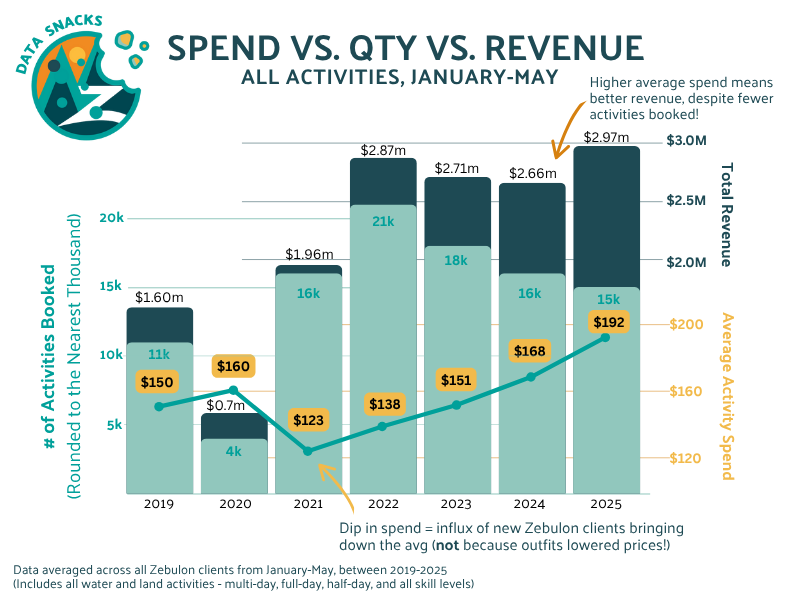
Updated: Customer Spend vs. Quantity Booked vs. Revenue
Published June 2025 – note the addition of revenue to the previous Data Snack comparing average spend with quantity booked.
Click on the image above to enlarge.
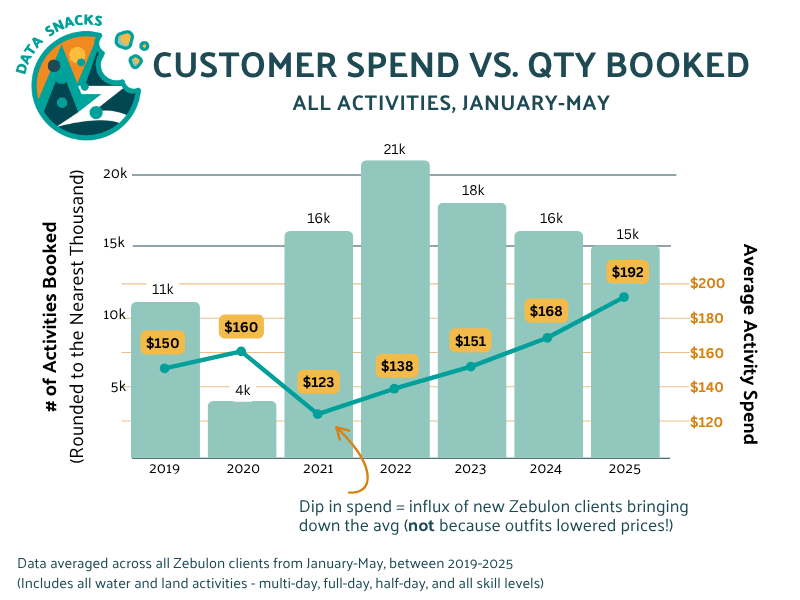
Customer Spend vs. Quantity Booked
Published June 2025.
Click on the image above to enlarge.
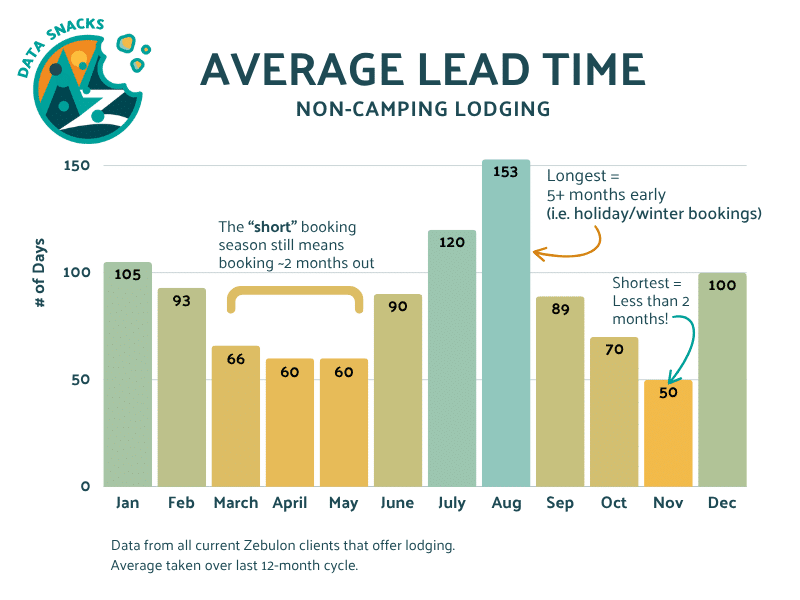
Lead Time: Non-Camping Lodging
Published June 2025.
Click on the image above to enlarge.
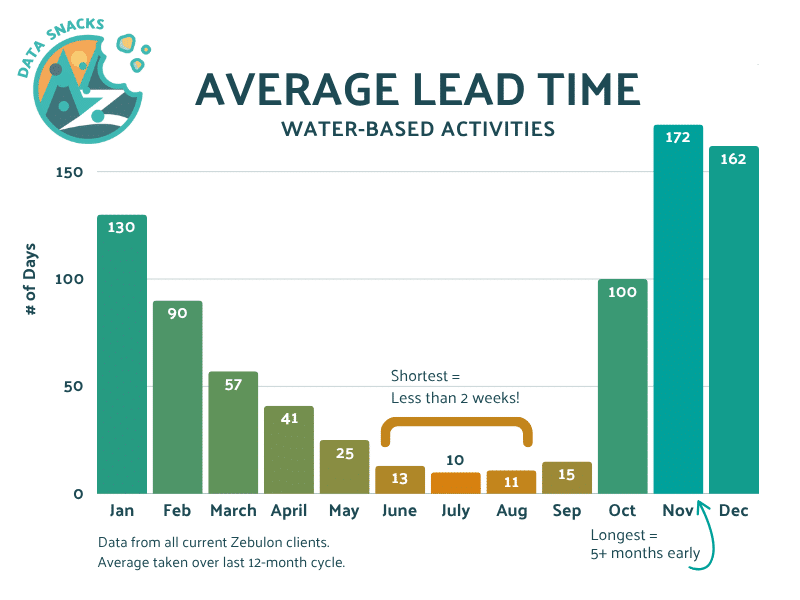
Lead Time: Water-Based Activities
Published May 2025.
Click on the image above to enlarge.
Treat yourself!
Want to see your data displayed in our Central Data Hub, plus receive our expert team’s real-time insights? Want to work on your business from the inside out, in a non-competitive environment made up of other outfit owners and leaders? Contact us today to explore which Zebulon service package is best for your business.